This is one of those cases where the label performance should not be taken at face value: U-value of glass units – if the glass is meant to be installed horizontal or with a tilt angle. The analysis shown here illustrates the performance of two different IGUs, depending on the tilt angle.
Thermal performance of insulated glass units (IGUs) is driven by the combination of 1) the number of gas pockets (or in layman’s terms, the number of glass panes), the thickness and the fill of the glass pockets, and the low-emissivity coatings (low-e) on the glass panes).
The gas pockets provide insulation because the gas (whether air, Argon, or Krypton) conducts less heat than a solid. The more still the gas remains, the higher its insulation property, the lower the heat losses.
However, the gas does move. In doing so, it is subject to gravity, meaning that its ability to provide insulation is impacted by the tilt angle of the IGU.
Unfortunately, manufacturers provide glass U-values assuming the glass is vertical, even for IGUs intended to be installed horizontally or at an angle – as in the case of skylights. In other words, the label value may not represent the actual performance of the glass.
The performance gap is not negligible – the heat losses through the glass can be up to 30-35% higher than the label value.
Of course, this does impact the risk for condensation, as well as the whole building energy performance.
I-Joist vs Larsen Truss:
Does it make a difference for exterior high R-Value insulating?
Many high-performance buildings, when addressing the issue of super-insulation, will opt for traditional 2×6 stud framing with an added layer of exterior insulation to help reach the higher R-Values. One affordable and popular way to do that is with dense-packed, blown-in cellulose or fiberglass.
When considering the framing options for that exterior cavity, many builders will be inclined to use I-Joists and assume that any thermal bridging caused by that type of framing is negligible.
The thing is… the higher the performance, the more these seemingly small details can result in a gap between the expectation and the result.
Enter the Larsen truss option. A Larsen truss, with its point-to-point gussets (the small strips of plywood that connects the inside chord to the outside chord of the truss), greatly reduces the effect of thermal bridging compared to the continuous web of an I-Joist.
Our graph pictured here shows percentage, but you can think about it in dollars for effect. For every $100 you spend on a nominal R-Value, the Larsen truss gives you $92.50 of performance, while the I-Joist only delivers $81.10. So you basically lose about 10% of your expected R-Value.
The higher your goal, the more educated you need to be in making decisions like this. You may still decide to go for the I-Joist, for labor reasons or otherwise, but it’s important to arrive there as a well-informed decision. Every element of good design/build is an evaluation of trade-offs.
Go forth. Learn. Make informed decisions. And #RunWildBuildPassive !
In this article, we cover two very important aspects of glazings: light transmission and the solar heat gain coefficient.
These parameters are extremely important for performing buildings and passive houses, however, they are often overlooked by both designers and window manufacturers.
We’re going to describe how silly it is to evaluate the quality of a window or a door by its average Uw value alone, even if it is calculated according to ISO 10077-2. About ISO 15099, we reserve judgment until we gain more confidence with the norm.
Thinking of window quality through its Uw value is as silly as saying that a zebra is a “light grey” or “dark grey” horse: it does not make sense.
If you think that a zebra is a grey horse, then the Uw value is all you need.
A mediocre window may look to be performing well, due to a very low transmittance value of glass, Ug, regardless of the fact that you may have condensation (or ice!) forming along the edge of the glass.
Ice forming along the edge of the glass, on the room side, due to very low window quality.Window in a passive house near Riga, Latvia.
THE VALUE OF A WINDOW
What’s the purpose of an opening? In a building, windows and doors:
connect the inside to the outside;
contribute to the overall aesthetic of the building;
create views;
allow for natural ventilation;
provide daylight to the interior environment.
Palazzo Rucellai in Firenze, designed by Leon Battista Alberti. Doors and windows have always played a fundamental role in the aesthetic composition of architecture.
The aesthetic value of openings in a building is undeniable.
Daylight requirement and energy performance of glass units may be in contrast with one another. To lower the thermal transmittance of glass, Ug, insulated glass units (IGUs) are created with double or triple glass panes, with low-e coatings (made of metal oxides).
With the same type of glass, the more the number of panes, the less light gets through. Choosing the type of glass (e.g. extra clear glass), can have a very important effect on the quality of the internal environment, in terms of daylight.
As far as low-e coating, if their quality is not excellent (standard coatings), a low thermal transmittance Ug is associated with a low light transmittance.
In order to conciliate low thermal transmittance and high light transmittance, the low-e coatings need to be “selective”. They need to be able to reflect the infrared component of the spectrum and transmit the visible light. This is why a proper specification of a glass unit includes the light transmission value (to be 70% or higher), besides the thermal transmittance Ug.
We’re going to publish an article on daylight, and how this is affected by the type of IGU (double pane vs triple pane; standard low-e vs selective).
SOLAR HEAT GAINS
Solar heat gains represent the portion of total solar radiation (visible light + infrared), that is transmitted through a structure, and penetrates into the building. For insulated opaque assemblies (walls, roof, etc.), the amount of transmitted solar radiation is negligible; for glazed elements, it is extremely important.
The term “passive” itself derives from the fact that a passive house is such an efficient thermal envelope, that the solar heat gains become a determining factor (as well as the interior heat gains).
The solar factor g, also called SHG (solar heat gains) represents the amount of total solar radiation transmitted by the IGU – it is expressed as a percentage, or as a number (from 1,00 to 0,00). As in the case of the thermal transmittance of glass, Ug, the solar factor g also has to be expressed with two decimal figures.
In a well-designed building, the openings can become the most cost-effective “solar panels”, and provide “free gasoline” (solar gains), to keep the building comfortable in winter and reduce the demand of energy for heating.
The solar factor g represents the amount of “free gasoline” provided by the windows to the building.
Let’s get used to seeing the solar factor g as “free gasoline”, provided by the glazed components of the thermal envelope (Image source: TurboSquid)
The solar factor g is a very important element in the energy design of the entire building, next to the thermal transmittance of the glass, Ug, and the light transmission.
The question a designer needs to ask is: does the building need solar gains?
In residential building, even in moderately warm climates (e.g. Northern Italy): probably yes;
In non-residential buildings, with high interior heat gains (high number of people, appliances, etc.): maybe no.
The solar factor has to be designed as an integral part of the thermal envelope so that its effect can be evaluated for both winter and summer.
OVERHEATING
Let’s remember that any unshaded glass (even single pane), can cause overheating: the cause of that does not lie in the thermal performance of the glass per se, but in poor design or use of the building.
A car parked in the sun. This is equal to an uninsulated building, provided with single pane glazings. Overheating is caused by human error (poor design, poor management, or both), not by the energy performance of the building or of the glass.
To avoid overheating and guarantee daylight, the best strategy is to provide the building with external adjustable shading devices. This allows building users to manage daylight and solar gains based on season and daily activity schedule.
A building without shading is like a car without brakes: if you lose control (if it overheats), it is not the fault of the accelerator.
If solar gains need to be constantly kept low (e.g. non-residential buildings, with high interior heat gains), the glass units can be provided with a low solar factor on purpose.
GOOD GLASS, BAD GLASS
Let’s have a look at a data sheet we received from a window manufacturer for a residential project near Reggio Emilia, Italy.
In the eyes of the manufacturer, the glass unit was extremely good, with a Ug value of 0,47 W/m2K (0,08 BTU/h*ft2*°F, about R12). In his mind, this would have allowed his 92 mm solid timber frame window to meet passive house requirements in the local climate (which is not true, because he was considering the bare Uw value, without installation thermal bridges).
The data sheet of the glass. Top left: the widow manufacturer highlighted in green the Ug value, which made him think that the IGU could be very performing.
If you keep in mind what described above, it is evident how this glass unit is really not very good, because is provided with low-quality low-e coatings, not selective ones.
A light transmission of 50% would probably cause the failure of the windows to provide the minimum daylight factor (2%), with electrical lighting being required during daytime.
On the other hand, a solar factor of 0,30 (30%) dramatically reduces the overall energy performance of the building, and increased the demand for heating, even if the thermal transmittance Ug is better than other glazings.
Is this a “bad” glass?
Glazings are very dynamic components of the thermal envelope. In order to understand if a glass unit is appropriate for a specific building, in the local climate, you need to carry out an analysis on the entire thermal envelope. This cannot be done by the window manufacturer: it needs to be done by the designer of the building.
CONCLUSIONS
Glazed openings provide a determining contribution to the energy balance of high-performing buildings and passive houses.
The selection of insulated glass units has to be made based on climate, urban context, and use of the building. Thermal transmittance of glass, Ug, has to be paired with light transmission and solar factor g.
The quality of glass has consequences on the overall quality of the building, in terms of comfort, daylight and energy efficiency. For this reason, the design of the glass units has to be carried out by the designer of the building, not by the window manufacturer.
We continue our series of articles on the thermal efficiency of windows, describing the glass edge thermal bridge.
As far as thermal bridges go, this one is inevitable, and it represents the weakest point of a well-designed thermal envelope. It needs to be analyzed carefully, in order to prevent condensation (or ice) to form on the edge of the glass, discomfort, and an overall drop in the performance of the window/door.
From the point of view of thermal comfort, windows and doors have a key role: proper components (passive house suitable) need to be selected depending on the local climate. This allows for good surface temperatures, that avoid asymmetry in radiant temperature, and glass edge condensation. On the opposite, a poor quality window makes feel “cold” in an environment even if the average temperature may be above 20°C (68°F). It can also allow for condensation to form along the edge of the glass.
The importance of good windows for thermal comfort in the built environment (image: Passivhaus Institut)
In a well-designed thermal envelope, the junction between glass and frame remains the thermally weakest node of the entire building. Here you have the lowest temperatures for the interior surface (fRsi factor).
Thermal image of a window in a passive house: glass spacers are brightly lit: if the building is well designed and built, the glass edge thermal bridge is the weakest spot in the entire thermal envelope (image by Enrico Baschieri, EcoDesign)
If this junction is not properly designed, you can very easily have condensation forming along the edge of the glass, because the local temperature on the internal surface of the glass drops below the dewpoint. If external conditions are particularly critical, you may even have ice forming along the interior edge of the glass (with the result of the room being very uncomfortable).
Ice forming along the glass edge in a poor quality window, on the room side, because of very low temperature.
You’d better not trust marketing brochures, as they often are the result of pure and simple barbaric marketing, instead of actual analysis on the products sold.
A commercial brochure (with our note highlighting condensation): here the isothermal analysis was done by the manufacturer itself contradicts its slogan, showing the poor quality of the window.
CALCULATING THE GLASS EDGE THERMAL BRIDGE, PSIg
As in the case of other thermal bridges, you need to calculate the PSI value (called “PSIg”, for the glass edge), and the temperature factor, fRsi, with a finite element calculation. To do this, you need the actual section drawing of the frame, the assembly of the glass, and the glass spacers.
The glass spacers are rigid elements used to connect (and to space apart) the glass panes of an insulated glass unit (IG). From the least performing to the most performing one, glass spacers can be made of:
aluminum
stainless steel
polymeric material (with or without stainless steel insert)
Examples of glass spacers in aluminum, stainless steel and hybrid (plastic-steel). Thermally more advanced glass spacers have no metal.
From the finite elements simulation point of view, the spacers can be modeled according to the real geometry of the spacer (which is more accurate, but free software like Therm cannot handle it well) or with the 2Box model.
The real geometry of a glass spacer: for an accurate finite elements calculation, you can request the dwg drawing of the spacer from the manufacturer.The geometry of the same spacer, for a simplified calculation with the 2Box model.
We’re going to compare the two methods in-depth in a dedicated article.
A window in a passive house: a high-performing glass pacer significantly reduces the glass edge thermal bridge, PSIg.
Just like any other transition between two elements having different thermal transmittance, the result of the finite element calculation is a bidimensional heat flow, L2D. This value is different from the sum of the two monodimensional heat flows, calculated for the glass (L1D_g = Ug * bg) and of the frame (L2D_f = Uf * bf). The difference between bidimensional and monodimensional heat flows it the glass edge thermal bridge, PSIg:
PSIg = L2D – (L1D_g + L2D_f)
In the case of the glass edge thermal bridge, the PSIg value referred to the internal measures and the external ones are exactly the same.
An image from ISO 10077-2, showing the “bf” measure, used to calculate the thermal transmittance of the frame. In the case of the glass edge thermal bridge, PSIg, the PSI value referred to internal measures is exactly the same as the one for the external ones.
WHAT INFLUENCES THE GLASS EDGE THERMAL BRIDGE?
Many factors have an influence on the glass edge thermal bridge, both in terms of heat flow (PSIg) and of surface temperatures (fRsi):
type of frame (wood, PVC, aluminum, glass fiber, steel, etc.);
with the same type of frame, the type of profile (bottom, side, central, etc.);
with the same type of frame and profile, the thermally effective portion of the profile (which varies with the thickness of the IGU);
type of glass (number of cavities, thickness of cavities, thickness of the glass panes);
type of spacer (aluminum, stainless steel, hybrid steel-polymer, polymer);
type of sealant used for the IGU (polysulfide, silicone, polyurethane, hot melt butyl);
indent depth of the glass inside the frame profile.
The same window has at least two different PSIg values because it also has two different transmittance values for the frame, Uf (one for the bottom profile, the other for the side/top one).
If the thickness of the glass unit varies, so varies the heat flow in the window frame and the PSIg value. This has an influence on the transmittance value of the frame as well.
Data provided by the manufacturers are acceptable only if all parameters listed above are exactly the same. In reality, the PSIg value has to be calculated on a by-project basis (for each profile), depending on the exact frame and glass types used.
The direction of the heat flow at the junction between the glass unit and the window frame. The image shows clearly that the thickness of the internal and external glass panes influences the PSIg value.
Can you use “average” values of PSIg?
With the list of variables listed above, it should be clear that the PSIg value does not like to be standardized.
the correct average PSIg value is calculated with a weighted average of the different PSIg values of one specific window;
the wrong average PSIg value is any number a designer of the building is ready to sign off for (as in the case of the Uf value for window frames, or the design lambda value for insulation materials).
One value that cannot be made “average” is the temperature factor fRsi, used to verify the absence of condensation on the glass edge. This value has to be calculated via finite elements, using the most realistic geometry of the junction (the 2Box model may not be accurate enough!). The correct fRsi calculation includes the entire junction, with the profile installed in the assembly of the wall/roof, so that the analysis can be as similar as possible to the future conditions of the installed window/door. Also, the acceptability of the fRsi value of the junction depends on the local climate.
CONCLUSIONS
The glass edge thermal bridge, plays a primary role in thermal comfort, absence of condensation (or ice), and energy efficiency of the window and of the entire building.
The values of heat flow (PSIg) and internal temperatures (fRsi), vary significantly depending on the window profile and glass unit (and many other parameters), so that standardized values are most likely wrong.
With higher expectations in terms of construction quality, even in energy retrofits, the glass edge shows how 21st Century designers are required to be more and more prepared. The important nodes of the thermal envelope need to be analyzed in-depth, so that comfort can be guaranteed, and the performance gap avoided.
After covering thermal transmittance U and resistance R of opaque assemblies, and insulated glass, we now cover one of the most critical areas of the thermal envelope: window frames.
Good windows are the cornerstone of a performing building for both comfort and energy efficiency, specially if it is a passive house.
In this article, we address the calculation of the thermal transmittance of the frame with computer simulation (finite elements): we’re going to cover the hot box lab test in the future, with the example of a wooden frame window.
The term “frame” used in this text refers to the entire profile, composed by the actual frame (the fixed part), and of the sash (the operable part). According to ISO10077-2, if there is a blind frame (aka buck), this is not included in the Uf calculation, and it is included in the calculation of the installation thermal bridge. We’re going to show later in this article.
Rendering of a wood-aluminum window frame suitable for passive house
MONODIMENSIONAL HEAT FLOW
In order to understand the Uf value of a window frame, you need to understand the U value of an opaque assembly first. Read our article here.
The U value of an opaque assembly is determined according to ISO 6946, granted that the element is composed by flat layers, parallel to each other, with little or changes in the material. For example, you cannot use this method if you have any metal profile within your assembly. The heat flow is also supposed to cross the assembly at a 90° angle.
An example of an external wall: if the assembly is flat, the heat flow occurs orthogonally to the surface of the layers, in a mono dimensional way.
In the case of insulated glass units (IGUs) as well, one of the conditions required to be able to calculate the transmittance value Ug is that all panes are parallel to each other.
3D model of an insulated glass unit (IGU): if the glass panes are flat and parallel to each other, the heat flow occurs in a mono dimensional way.
BIDIMENSIONAL HEAT FLOW
In the case of window frames, the element you intend to analyse is not composed by flat, parallel layers: the geometry is in fact very complex, including opaque elements, metal elements, and cavities.
The bottom profile of a wooden window.3D view of the same frame.
A complex geometry determines a bidimensional heat flow, so that the thermal transmittance cannot be calculated with simple formulas.
The isotherms in the bottom profile: the fact that they are curved shows that the heat flow occurs in two dimensions.
This is the reason why, the Uf value of a window needs to be calculated with a finite elements software, according to ISO 10077-2.
In the US market, the National Fenstration Rating Council requires the analysis to be carried out according to ISO 15099. Please note that the results of the analysis on the same window, using ISO 10077-2 and ISO 15099 cannot be compared with each other, because they are determined with two different norm.
We’re going to explain this difference between the two norms in a specific article. In the mean time, remember that you don’t get to choose freely one or the other norm: it depends on where you need to use the number down the line (for example, PHPP requires ISO 10077-2).
Also, remember that is not a norm to make a good window: it is a good window manufacturer. Numbers are just numbers.
The triangles created by the finite elements software to analyse the bottom profile of the window.
The Uf value varies according to the geometry of the frame, which dictates the bidimensional heat flow. It is very common for normal windows have to have at least two separate Uf values: one for the bottom profile, and another one for the side/top frame. If the window has two sashes, the central profile is going to have its own Uf value.
The side/top frame profile of the same window.3D view of the side/top frame profile.The isotherms in the side/top frame profile.The triangles created by the finite elements software in the side/top frame profile.
The question you may ask is:
Can you use an average Uf value?
It depends on what kind of responsibilities the designer is willing to take onto himself/herself.
A correct average Uf value is determined on the base of the correct real Uf values of the profiles, and on the geometry of the individual window. Therefore each window has its own average Uf value. The correct average Uf value does not allow for time savings.
The wrong average Uf value can be calculated on a standard 1-sash window of 1.23×1.48 m (4×5 ft). This would not take into consideration multiple sashes that may be present in the building. Even if the window manufacturer provides you with average Uf values, the responsibility of the values uses in the calculation remains with the designer of the building. As in the case of the design lambda value of a material, for the average Uf value as well the designer is free to pick any number he/she is ready to answer for.
THE Uf VALUE: A FICTITIOUS THERMAL TRANSMITTANCE
Let’s look at the calculation.
How do you calculate the Uf value of a window frame?
According to ISO 10077-2, you calculate the heat flow of the window frame, in the case where the glass is replaced by an hypothetical panel of insulation material (with standard lambda value of 0,035 W/mK), having the same thickness and indent of the glass unit.
Modeling the window frame with the insulation panel, according to ISO 10077-2.
The finite elements software calculates the total bidimensional heat flow, L2D, that goes through the frame and the panel.
Calculationg the bidimensional heat flow for the bottom frame profile, to determine its Uf value according to ISO 10077-2.
The L2D value represents the total heat flow. From this value, you need to subtract the heat flow going through the panel (L2D_p), calculated according to its thermal transmittance (as ISO 6946), and its length bp. The length of the panel (bp) is set by the person that creates the model in the finite elements software.
L2D_p = Up * bp [W/mK or BTU/h*ft*F]
The remaining amount of heat flow (L2D_f) represents the flow that occurs through the frame:
L2D_f = L2D – L2D_p [W/mK or BTU/h*ft*F]
This value is still expressed in W/mK or BTU/h*ft*F: it shows the amount of heat (W/K or BTU/h*F) that the element exchanges with the outside per unit of its length (m or ft). To make this value “compatible” with a thermal transmittance (W/m2K or BTU/h*ft2*F), you need to refer it to the area of the frame, by dividing it by the width of the frame:
Uf = L2D_f / bf [W/m2K or BTU/h*ft2*F]
The transmittance value of the frame, Uf, is a fictitious value, that is functional to the “architecture” of the overall energy calculation. The bidimensional heat flow, L2D_f, is spread across the width of the frame, bf (as you would do with Nutella on a slice of bread).
When calculating your diet (energy balance), in order to know the total calories intake (total L2D), it is not enough to know how thick is the layer of Nutella (Uf value): you also need to know how large you slice of bread is. Nutella per square meter or square foot (Nut/m2 or Nut/ft2): the unit that will make physics understandable one and for all.
This shows how the thermal transmittance of a window depends on its total heat flow, L2D_f, given by the width of the frame, bf, and its transmittance value, Uf.
Without the width value bf, the transmittance value Uf has no meaning at all.
You can use the Uf value only if you refer it to the bf value, so that the energy calculation can recreate the correct heat flow as L2D_f = Uf * bf.
To compare the energy efficiency of two different window frames, it is wrong to compare the Uf values alone. You need to compare at least their L2D_f values. A more accurate comparison is prepresented by the PSI_opaque value, used by the Passivhaus Institut to divide window frames into classes. We’re going to cover this in a specific article.
ISO 10077-2 describes what constitutes the frame of the window, so that you can determine the width of the profile (bf value).
The diagram in ISO 10077-2, showing the width of the frame, bf, used to calculate the Uf value.
In case of blind frames (aka bucks, in the US), these do not belong together with the frame in the Uf calculation. Their contribution to the heat flow of the junction is calculated in the installation thermal bridge, PSI_inst.
CONCLUSIONS
Windows and doors have a primary role in the thermal quality of highly performing buildings and passive houses, both for comfort and energy efficiency.
In order for the overall energy design to be accurate and consistent, the designer has to calculate the transmittance values of the frames. The precision and consistency of these values with other parameters of the energy balance influence directly other values down the line, including the Uw value, installation thermal bridges and so on.
A major concern for the US market, where ISO 10077-2 and ISO 15099 coexist, is that you cannot use the results obtained by the two norms interchangeably: you need to know where you are going to use those numbers. As an example, PHPP requires ISO 10077-2; other softwares may require ISO 15099.
From the ISO 10077-2 method, it is clear that the Uf value makes sense if and only it is used with the correct value of its width, bf.
To compare the thermal performance of window frames, it is wrong to do so by the Uf value alone. You need to compare them at least by their L2D_f value, calculated as L2D_f = Uf * bf.
NOTE
The L2D heat flow used to determine the thermal transmittance of the window frame, Uf, was calculated with Dartwin software.
To achieve thermal comfort and energy efficiency in buildings, a primary role is played by the thermal envelope: this is required to thermally decouple the indoor environment from the ever-changing external conditions, both in summer and in winter.
The structures of the thermal envelope need to be able to control the amount of heat migrating through them: the thermal resistance and the thermal transmittance are two ways to describe this phenomenon.
Thermal Resistance and Th. Transmittance are two ways to describe how “insulated” a structure is: each of them has its pros and cons, but they are the two sides of the same coin.
The base assumption is to have a constant heat flow through an opaque structure, defined by two parallel flat surfaces. This is the case of external walls (or roof) of a building, in winter. The thermal behavior of the opaque components of the envelope in summer is substantially different, and it is going to be addressed in a specific article.
On the left, a typical wall assembly; in the middle, the heat flow going through the structure; on the right, the distribution of temperatures within the structure
Such structures can be made by one or more layers of homogeneous materials, which can vary from layer to layer. The reference norm is ISO6946.
If elements of different materials are present in the structure (such as wooden joists), they represent thermal discontinuities, in other words: thermal bridges and the additional heat flow need to be calculated according to ISO 10211.
THE R-VALUE: THERMAL RESISTANCE
The thermal resistance – also called R-value – is a parameter used particularly in North America.
This value describes how a structure, or a single layer of it, opposes the heat flow running through it. The R-value is proportional to the thickness of the layer and inversely proportional to the thermal conductivity (lambda value) of the material that the layer is made out of. The thermal resistance is measured in m2K/W in the International System and in h*ft2*°F/BTU in the Imperial System.
R = s / ?
s: thickness of the layer
?: thermal conductivity of the material
The increase of the thermal resistance of a layer is directly proportional to its thickness: if you double the thickness, the resistance is also doubled. For this reason, the R-value is a very practical parameter, that does not require complex calculations.
For example, in the case of a 50 mm (2″) rock wool panel:
R = s / ? = 0,050 m / 0,037 W/mK = 1,35 m2K/W
(R = 2″ / 0,021 BTU/h*ft*°F = 8 h*ft2*°F/BTU)
If we increase the thickness or the number of layers, the R-value increases accordingly:
if you double the thickness, the resistance also doubles.
When calculating the total thermal resistance of a structure, you also need to take into account the surface resistances – the resistance provided by the layer of still air on the inside of the structure (Rsi = 0,13 m2K/W, 0,75 h*ft2*°F/BTU, for vertical elements), as well as on the outside (Rse = 0,04 m2K/W, 0,23 h*ft2*°F/BTU).
The advantage of the R-value is its practicality; the disadvantage is that its value is not directly proportional to the actual heat flow migrating through the assembly, and therefore it can be misleading.
To have a precise picture of the amount of heat being transferred from one side of the structure to the other one, you need to look at its thermal transmittance.
THE U-VALUE: THERMAL TRANSMITTANCE
The thermal transmittance describes the heat flow occurring between the two flat and parallel faces of an opaque structure. This is called the U-value of a structure (as opposed to its R-value), and it is particularly used in Europe. It is measured in W/m2K in the International System and in BTU/h*ft2*°F for the Imperial System — the inverse unit as the R-value.
The thermal transmittance of a structure is calculated as the inverse of the sum of the resistance of all its layers, including the interior/exterior layers of still air:
U = 1 / Rtot
Rtot: sum of the thermal resistances of all layers of the assembly, including
The thermal resistance of the structure increases proportionally to the thickness of its layers; the thermal transmittance, on the other hand, follows a hyperbolic curve:
Comparing the increase of thermal resistance (R-value) and the decrease of the total heat flow (U-value) – (BEA)
This is the reason why the increase in the “insulation” (that is, the decrease of heat flow) provided by an increase of the thickness of the material is not directly proportional to the increase of thickness.
Following the previous example about rock wool panels, the total transmittance of the assembly becomes:
if you double the thickness, the increase in the “insulation” is less than double
The advantage of using the thermal transmittance (U-value) of a structure is that the value is directly related to the actual heat flow migrating through the structure; the disadvantage is that the calculation to achieve it is not as simple as for the thermal resistance.
The lambda value of a material indicates its ability to transfer heat: this property is therefore very important in the design of high-performing buildings and passive houses.
The information commonly available is unfortunately quite confusing: with this article, we’ll try and shed some light on the topic.
In Europe, the lambda value [?] of a material belongs to the data that the manufacturer has to include in the data sheet of a product, in order to be allowed to put it on the market. This counts for any kind of material (cork, rock wool, but also concrete, glass, steel and so on), but it is of particular importance for insulation materials, which we described in a previous article.
Part of the data sheet of insulation materials, with the lambda value declared by the manufacturer
In the US, on the other hand, this value is not very widespread: insulation products are organized by R-values, that describe the thermal resistance of an insulation panel of a given thickness.
If the energy analysis is not very accurate, using the R-value alone can be enough, limiting the calculation to a monodimensional heat flow simulation. In this case, you don’t need to know the lambda value of the material (which has already been used to calculate the declared R-value). For bidimensional or tridimensional heat flow calculations, however, you do need to know the lambda values of the products you are simulating. This is the case, for example, of a finite elements calculation of a thermal bridge.
Sample of bidimensional heat flow calculation (L2D), used to assess the PSI value of a thermal bridge
In the design of the thermal envelope of any building, and even more so of a passive house, one of the first steps the designer needs to take is to establish the design thermal properties of the materials used in the project.
It goes without saying that such an important value can become the object of barbaric marketing by manufacturers of insulation materials.
HOW IS THE LAMBDA VALUE DETERMINED?
The reference norm is ISO 10456, which includes the calculation methods to determine the declared lambda value of a material and the design lambda value. The norm also includes data tables of design lambda values for standard construction materials (wood, plastics metals, and so on), which are less performing from a thermal point of view, and therefore less subject to changes in their overall performance due to installation conditions.
Some of the design lambda values for standard insulation materials, from ISO 10456
Overall, the lambda value of a material (that is, its ability to transfer heat) varies depending on three main factors:
The actual temperature of the material installed
Its humidity content
Its aging process
Variability of the lambda value of EPS depending on temperature (ANIT)Variability of the lambda value of wood depending on moisture content (and density)
DECLARED LAMBDA VALUE
The declared lambda value, [?d], represents the thermal conductivity of a material as tested in a lab.
Its value is calculated statistically by the manufacturer, on the basis of multiple lab tests.
These tests are carried out with constant conditions of temperature and humidity. The aging of the material is already included in the declared lambda value, whereas the influence of installation temperature and humidity conditions need to be calculated by the designer, according to the specific building conditions.
Testing the heat flow through a panel of insulation material, to calculate its declared lambda value (Stirolab)
For the declared lambda value to be acceptable, it has to be based on a minimum number of tests, usually 10.
Testing results on ten material samples (from ISO 10456)
As mentioned, the declared lambda value is calculated statistically from the test results, with ISO 10456. The declared lambda value ensures that the result is valid for 90% of the produced material, with an accuracy level of 90%. This is why the declared value can also be described as [lambda 90/90].
Statistical distribution of the lambda values from the test results, with the typical Bell curve (BBA)
DESIGN LAMBDA VALUE
The design lambda value represents the thermal conductivity of a material as installed in a building.
This value needs to be calculated by the designer, according to the specific internal and external design conditions (temperature, humidity), which influence the performance of the material once installed. As previously described, the aging of the material is already included in the declared lambda value.
Depending on different installation conditions, one material can have several design lambda values, even within the same building.
Example of design physical properties for the construction materials, curated by the thermal designer of the building
The design value is calculated by the designer (or energy consultant), starting from the declared lambda value included in the product data sheet.
CAN I USE THE DECLARED LAMBDA VALUE AS THE DESIGN VALUE?
Many questions come to mind:
As a designer, do I have to calculate the lambda value for each different installation conditions?
Can I use the declared lambda value, calculated by the manufacturer, as my design lambda value in the design of the building?
If I use the declared lambda value, is the manufacturer liable for it?
At least in a European context, the answer to those questions is easy: the designer is required to assess the performance of the installed material.
The manufacturer is liable for the material performance in lab testing;
The designer is liable for the performance of the material installed.
As the designer, you can use any lambda value you want, as long as you are ready to answer for it.
The lambda value used in the energy design has a direct effect on the estimated energy performance of the building, for both energy demand and heating/cooling loads.
ONE-OFF CALCULATION OF THE DESIGN LAMBDA VALUE
The calculation of specific design lambda values for insulation materials can be very time-intensive. Within the same project, the same material can have different design lambda values depending on the installation conditions (e.g. slab on the ground, roof).
If we implement the practical approach of the DIN4108 norm, you can do a one-off calculation of the design lambda value of a material, as follows:
Design lambda value = declared value + 20%.
Such an increase is conservative relative to an accurate ISO10456 calculation, and it allows to always use the same design value regardless of the installation conditions.
In the case of a rock wool insulation panel, for example:
In case the manufacturer subscribes to third-party quality control, the quality of the production can be assumed to be more consistent, and the increase of the lambda value can be limited to 5%.
Rock wool insulation panel, with third-party quality control:
We cover here two real examples of mold and condensation problems, with thermal insulation installed on the inside of existing masonry walls.
In both cases, the solutions were chosen on an empirical basis, and turned out to be worse than the problems they were trying to mitigate.
The examples come from two separate residential buildings, both located near Reggio Emilia, Italy.
The first case is an habitable attic, showing condensation problems: in this article, it is shown only with details and finite element calculations. The second one is a bedroom, with mold problems, here illustrated with photographs (including the title picture).
THE PROBLEM
The first example – the attic – has a condensation problem, with water drops forming on the internal surface of the wall, along the perimeter concrete beam at the junction between the external wall and the wooden roof.
Detail of the wall-to-roof junction, showing the concrete perimeter beam.
The wall-to-roof junction represents per se a geometrical thermal bridge: all edges of the thermal envelope are thermal bridges. On top of this, you need to add the thermal bridge effect caused by the material change in the junction, where the concrete “loses” more heat than the brick masonry. The external wall is made with standard baked clay, load bearing bricks, without any insulation (in this phase); the concrete beam is required due to seismic compliance.
The higher heat flow at the wall-to-roof junction, due to the geometry of the envelope and to the concrete perimeter beam.
As you can see from the image, the combination of geometry and material change, generates a higher heat flow between inside and outside: a thermal bridge.
Isotherms at the wall-to-roof junction.
This higher heat flow causes lower internal surface temperatures, with a lower thermal comfort level inside the room.
Simulation of surface condensation conditions according to ISO 13788.
From a health point of view, lower internal temperatures allow for mold and condensation to form on the surface of the wall. This is often the case also in energy efficient buildings that are not provided with a mechanical ventilation system.
An example of mold forming on the interior surface of walls and ceiling – photo by Damiano Chiarini.
Although they are two separate phenomena, mold and condensation both depend on a combination of low internal temperatures and high relative humidity.
If you do know what causes these phenomena, the solutions are relatively straightforward. If you don’t, and of you try and fix the problem with empirical solutions, the solution may end up making things worse.
A SOLUTION WORSE THAN THE PROBLEM
In the case of the attic, the contractor suggested to install a cavity wall on the inside of the existing masonry wall, with insulation in it. The reasoning line was: “whenever we have condensation, we always to this”.
Let’s analyse this option.
The solution suggested by the contractor, with insulation on the inside.
The cavity wall is supposed to be 5 cm (2”) thick, with 4 cm insulation, and drywall finish.
Heat flow at the wall-to-roof junction, in the case of internal insulation with a cavity wall.
The heat flow at the wall-to-roof junction would in fact be lower, thanks to the insulation included in the cavity wall.
Isotherms in case of internal insulation.
If the heat flow at the junction is lower, the surface temperature at the junction is higher, with a higher thermal comfort.
Finite element analysis of the risk of condensation, according to ISO 13788.
The cavity wall with insulation eliminates the risk of condensation on the inside surface of the drywall, at the junction with the roof. Same result for the risk of mold: no apparent problem on the surface of the drywall.
Glaser diagram of the external wall, including the cavity wall insulation, according to ISO 13788.
If the problem seems to be solved at the junction, the truth is that it is only hidden. With a Glaser diagram analysis (which allows to assess the risk of condensation within an assembly), you can see that now the problem is present not only at the junction, but throughout the assembly. In this case, the insulation in the cavity wall causes the temperatures on the masonry wall to be too low, causing a widespread condensation problem.
Luckily enough, in this case the home owner followed our advice, and decided not to install the cavity wall.
IF IT SMELLS LIKE MOLD, THERE IS MOLD SOMEWHERE
In a very lucky way for the intention of this article, the second example demonstrates the validity of the analysis described above.
In this case, the object is a bedroom, where an internal cavity wall with insulation was installed along the external wall.
The cavity wall in the bedroom, before its demolition – photo Emu
At the time of our site visit, the bedroom had a strong smell of mold, although it showed no visible signs of it.
The cavity wall was demolished, unveiling a widespread mold problem on the plaster of the masonry wall – photo by Thomas Ficarelli
The demolition of the cavity wall brought to light a substantial mold problem, with the entire internal surface of the masonry wall affected by it.
Mold had thoroughly covered the entire internal surface of the wall, demonstrating the validity of the Glaser diagram illustrated above – photo by Thomas Ficarelli
Coincidentally, the situation we discovered in the second case, confirms the Glaser analysis done for the first building.
The second case was also was caused by an empirical approach (“we always do this”), lacking a correct approach to the problem under a hygrothermal and air tightness point of view. This does not mean that insulating on the inside is always bad: it means that you need to know what you are doing.
We also want to point out how transpirability of building assemblies is a parameter often overrated – we’re going to cover this topic in a specific article.
CONCLUSIONS
Healthiness of the buildings we live in must be a priority, above other goals such as energy efficiency.
We spend one third of our life in one single room – the bedroom: if this room is not healthy, it is going to make us sick, whether in the short run or in the long one.
Saving money and skipping appropriate technical analyses at first, is going to get back to you in the form of medical bills. It’s your choice.
Far too often, empirical solutions are selected with the motto “we’ve always done it this way, and we never had any problems”. Problems are there, they may just be hidden, as in the case of the bedroom above.
Physics is not democratic: your case is no exception.
To avoid mold and condensation problems, you need to address the problems with proper technical skills. The alterative is to face the consequences later, both economically (by redoing the work), and with your health.
NOTES
The Glaser analysis and the finite element calculations have been carried out with Dartwin software.
With more and more people talking about building energy efficiency and passive houses, it has become more and more common to hear about insulation.
In this article, we explain what an insulation material is, to try and shed some light on the topic, and bust some myths.
The energy efficiency of a building, as well as its comfort level, are based on the quality of its thermal envelope. This statement is valid for both winter heating, and summer cooling.
The best way to achieve that, is to decouple the indoor environment from the external conditions, so that the internal conditions (temperature and humidity) can be controlled with a minimum amount of energy.
Schematic diagram of an efficient thermal envelope, with the insulation layer (yellow) wrapping around the heated/cooled portion of the building
The compactness of the envelope remains of primary importance. Besides that, the decoupling of the inside from the outside is achieved by inserting one or more insulation layers within the structure of the envelope (walls, roof, openings and so on). The envelope needs to be airtight too.
WHAT ARE WE INSULATING FROM?
In the first place, you need to understand what you what to insulate from.
The main goals for insulation are:
– protection from cold weather;
– protection from hot weather;
– protection from noise.
To improve the energy efficiency of a building, the structures that require insulation are the ones that define the thermal envelope, which enclose the heated/cooled part of the building.
Andrew Michler’s passive house near Fort Collins, Colorado
In this article, we address the first point of the list: insulation to protect from cold weather. We’re going to address the issue of protection from hot weather and from noise in our future articles.
KINDS OF INSULATION MATERIALS
Insulation materials can be grouped into two families: materials that insulate via conduction (that is, materials that delay the heat transfer by having poor conduction level), and materials that insulate via radiation (materials that have low heat emission via radiation). This article is dedicated to the first group.
Insulated glass units (double-pane or triple pane glass) work in a quite different way, and we’re covering them in a separate article.
CONDUCTION INSULATION
Cellular glass insulates via conduction: as a panel (black, vertical), and gravel
In all materials that insulate via conduction, it’s not the material per se to insulate, but the air that is trapped in it (or the lack of air, in case of vacuum panels).
Overall speaking, an insulation material needs to be lightweight, because it has to contain a lot of air.
Heat transfer through a material, via a combination of conduction, convection and radiation (ANIT)
The “ability” of a material to insulate is described by its lambda value (which actually represents the opposite, that is, the ability of the material to conduct heat).
The insulative properties depend on the kind of material (cork, rock wool etc.), and on its density. This can range from 20 kg/m3 (1.25 lb/ft3) to up to 250 kg/m3 (15 lb/ft3), depending on the final use of the material.
The lambda value of EPS depending on its density (MAICO)
The lower the lambda value, the more insulative the material. Keeping this in mind, here are some typical lambda values (*) for insulation materials, ordered from the most performing to the least one:
PUR: 0,024 W/mK (0,014 BTU/h*ft*°F);
EPS with graphite: 0,031 W/mK (0,018 BTU/h*ft*°F);
Rock wool: 0,035 W/mK (0,020 BTU/h*ft*°F);
Wood fiber: 0,039 W/mK (0,023 BTU/h*ft*°F);
Cork: 0,045 W/mK (0,026 BTU/h*ft*°F).
(*) Please note that the values listed here are declared lambda values. We’ll have a chance to explain the difference between declared lambda value and design lambda value in a specific article.
COMMON MYTHS ON INSULATION
Generally speaking, a material is considered to be “insulation” if its lambda value is around 0,040 W/mK (0,023 BTU/h*ft*°F).
A common myth, widespread among non-professionals (at least in Italy), is that brick or stone masonry is per se insulative. With an equivalent lambda value of 1,4 W/mK (0,809 BTU/h*ft*°F), stone masonry “loses” 35 time more heat than an average insulation material.
Just to comply with current Italian energy requirements, the total thickness of such a stone masonry wall should be over four meters thick (13 feet); it should be over nine meters thick (29 feet) to meet passive house requirements.
With its very thick stone masonry walls, this prehistoric Nuraghe in Sardinia is probably one of the few stone buildings that can be considered “insulated”
IS WOOD AN INSULATION MATERIAL?
Another common myth, quite common also among industry professionals, is that wood is an insulation material. With an average lambda value of 0,13 W/mK (0,075 BTU/h*ft*°F, for fir or spruce wood), wood conducts heat three times better than an insulation material.
Wood is not an insulation material.
As a secondary myth, many believe that structural elements made of wood do not cause a thermal bridge when crossing an insulation layer.
The thermal bridge caused by a wooden balcony. On the right, the isotherms
Can you see the isotherms, on the right? Can you see how they bend where the wood slab crosses the insulation layer? That’s a thermal bridge.
As pictured in the finite element analysis above, a wood element crossing an insulation layer causes a thermal bridge. Sure, the entity of such a bridge is several times lower than it would be if the element was made of metal or concrete.
In case of highly efficient buildings and passive houses, however, you need to take all these thermal bridges into account: the more efficient the building, the more precise the calculation needs to be. The thermal bridge above does not cause any problems as far as internal temperatures (fRsi = 0,94); however its PSI value (0,0247 W/mK) is quite substantial in a context of energy efficient buildings, and cannot be overlooked in the energy balance.
With this article, we address one of the most important topics in the field of energy efficiency: the airtightness of the thermal envelope.
Whether the building is new construction or a renovation, its airtightness plays an important role in the comfort, energy efficiency, and durability of the structure.
AIRTIGHTNESS AND TRANSPIRABILITY
In the first place, we need to draw a line between airtightness and transpirability: they are two very different concepts, although they are used often (and mistakenly) as synonyms.
Transpirability is the ability of the thermal envelope to be “open” to water vapor only.
Airtightness is the perviousness of a structure of the building envelope to air, through holes, gaps, cracks – you name it. These represent defects, whether they are caused by poor design or faulty construction. The more holes in the structure, the more air is going to leak in and out of it.
Damage in a wooden roof caused by lack of airtightness. Photo by Peter Yost
AIRTIGHTNESS OF THE THERMAL ENVELOPE
When you talk about airtightness of a building, you refer to its thermal envelope: unheated rooms don’t play a role in it.
The airtightness can be measured on site, with a blower door test according to EN 13829. During the test, all exterior openings (doors, windows) are closed, and the building is pressurized to find air leaks. This test allows to evaluate the overall airtightness of the whole envelope.
A blower door test on one of our buildings
With the test, you can measure the volume of air extracted by the testing appliance (see photo): by dividing that value by the net ventilated volume of the envelope, you obtain the airtightness value of the building. The higher the volume of air extracted, the more air leaks are present.
As an example, airtightness values of a building envelope can be:
Masonry house from the 70s: 5,0 1/h
Timber house from the 70s: 11,0 1/h
Current house: 2,5 1/h
Passive House: 0,6 1/h
A complete airtight building would achieve 0,0 1/h: this is basically impossible to obtain regardless of the type of structure you choose (masonry, wood, etc.).
COMFORT
A non-airtight envelope allows for air leaks. In winter, this phenomenon has two negative effects.
In the first place, in the proximity of the air leak, you can feel the cold air moving, which is per se a cause of discomfort.
In the second place, these leaks allow for more air stratification inside the building, with a relevant temperature difference between the floor and the ceiling: this is perceived by the human body as discomfort, even if the room temperature may be higher than 20°C (68°F).
ENERGY
Airtightness equals absence of air leaks, so it is quite straightforward how:
airtight = efficient
The “energy weight” of the air leaks on the overall energy demand for heating depends on the efficiency of the building: we’re going to dedicate a specific article on this matter.
As an example, for the two Passive Houses in Cavriago, the building envelopes are designed to allow a maximum “leakage” of 0,6 1/h. In this case, the energy demand for heating due to air leaks is 11% of the total for each building. If the very same building, with the same insulation level (walls, roof, etc.) had a less airtight envelope of about 1,5 1/h, the “energy weight” of the air leaks would count for more than 20% of its total heating demand: you’d even have to change its heating system!
Airtightness is built one detail at a time.
DURABILITY
So far, we’ve described airtightness as cold air leaking into the thermal envelope: this is correct but incomplete.
In winter, when the indoor environment is warmer than the outside, external cold air is denser and heavier than the internal one. For this reason, cold air tends to leak into the building from the bottom, pushing out the warm air from the top. If this warm air manages to escape through holes and cracks of the thermal envelope, it is going to release water condensation along its path.
A 1 mm wide crack, 1 m long, can bring up to 800 g of water into the structure of the envelope, every day! (*)
You can easily understand the damage that such an amount of water can cause to a building. The insulative properties of a wet material drop dramatically: condensation undermines the energy performance of the building.
In just a few years, however, the condensation can permanently damage the structures of the building. It is the case of wooden structures (in all the wide variety they come in): if these assemblies are not airtight, they are most likely doomed to rot.
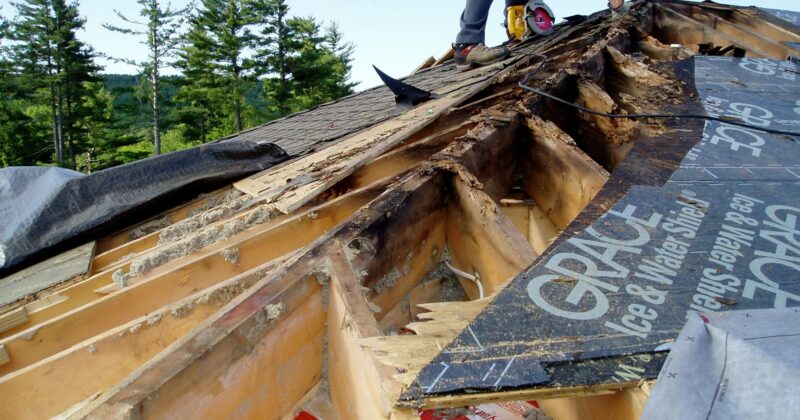
Bottom left: a portion of the roof was airtight so that the structure has suffered no damages. Top right: a portion of the roof that was not airtight, so that the condensation caused the wooden beams to rot (see Note 1).
Masonry or concrete structures are less easily damaged by condensation, because they are born “wet”, meaning that their construction process involves the use of water, so they are less sensitive to it.
AIRTIGHTNESS AND MOLD
If innovation in comfort and efficiency pushes architects to design more performing buildings, at the same time, building users need to learn how to use these buildings properly.
You cannot use an airtight building the same way you’d use a leaky one, otherwise, you’re going to face a very likely mold and condensation problem.
Example of mold – photo by Damiano Chiarini.
Airtightness is not to blame: the user is!
In case the building is not provided with a mechanical ventilation system, the user is responsible to regularly exchange the indoor air to provide the rooms with fresh air and get rid of water vapor created by breathing, cooking, washing, etc.
This topic is extremely important for the indoor air quality of a building, and we invite you to read our article on mechanical ventilation.
DESIGN AND CONSTRUCTION
Airtightness needs to be designed: whoever is in charge of the thermal envelope, needs to address this feature for all the structures of the thermal envelope (roof, wall, etc.), and for their junctions as well.
You cannot hope to address airtightness by guessing solutions when the building is under construction.
An example of a wall to roof junction for a Passive House: the airtightness elements are highlighted in red.
Design aside, airtightness is probably one of the most difficult goals to be achieved during the construction. A single crack can cause very large damage. This is why a very detailed design cannot replace good site supervision, carried out by a competent professional.
To guarantee the airtightness of the envelope, it’s a good business practice to run a preliminary blower door test before the final finishes are in place, in case you need to seal some unexpected leaks.
AIRTIGHTNESS AND RENOVATION / RETROFIT
Airtightness is very important in any project, including building renovations and energy retrofits.
The level of airtightness you can achieve in this kind of project depends on many variables – the type of structures, the depth of the renovation, and so on. Boundary conditions in existing buildings increase the complexity of the problem, but nothing is impossible.
Compared to the airtightness levels listed above, in a renovation, you can dramatically improve the existing conditions, and cut air leaks by a considerable amount. From a very leaky thermal envelope (5,0 1/h), it is usually quite feasible and cost-effective to achieve an acceptable tightness level (1,0-1,5 1/h), with a reduction of leaks around 80%.
NOTE (1): THE ROOF IN THE PHOTO
The roof in the photo is provided with an aluminum vapor barrier on the inside (warm side) and a plywood panel with a bituminous membrane on the outside. We could have a whole conversation on vapor barriers versus structure transpirability, but that would be off-topic. From the point of view of building physics, the structure was designed properly.
The cause of the beams rotting is not a widespread condensation problem — otherwise, all beams would have suffered from the same issue. You can see how part of the structure remained untouched by the problem (bottom left). The phenomenon is caused by a localized lack of airtightness, which caused some of the beams to rot.